Neural Network Inverted Pendulum Controller
MLP trained from scratch to swing up and balance an inverted pendulum via imitation of a classical expert.
Overview
The goal of this project is to train a single multilayer perceptron (MLP) to swing up and balance an inverted pendulum on a cart, starting from the stable hanging position. The network and backpropagation are written from scratch in Python and NumPy. The expert controller uses SciPy to solve the Riccati equation for its LQR gain.
The approach is supervised imitation learning. A classical two-phase expert controller: an energy shaping swing-up pump followed by a linear-quadratic regulator (LQR) to catch and balance the pendulum, generates a dataset of state-action pairs, and the MLP is trained by ordinary regression to reproduce the expert's behaviour.
Dynamics
A cart of mass $M$ sits on a frictionless track at position $x$, with a pendulum of mass $m$ and length $l$ pinned to it. The angle $\theta$ is measured from the upward vertical, so $\theta = 0$ is the unstable upright equilibrium and $\theta = \pi$ is the stable hanging position. The Euler-Lagrange equations govern the full coupled system; the simulator treats the network output as the cart acceleration $\ddot{x}$ directly and integrates
$$ \ddot{\theta} = \frac{g}{l}\sin\theta - \frac{\ddot{x}}{l}\cos\theta $$using semi-implicit Euler at fixed timestep $dt = 0.01$, with $g = 10$ and $l = 1$. Angles are kept in $[-\pi, \pi)$ relative to upright via the wrapping map $\operatorname{wrap}(\theta) = ((\theta + \pi) \bmod 2\pi) - \pi$.
Expert controller
The expert controller was implemented in data_gen.py, the details of each control phase are outlined below:
Energy-shaping swing-up
The pendulum's angular energy per unit mass is $E = \tfrac{1}{2}l^2\dot\theta^2 + gl\cos\theta$, with target energy $E_{\text{top}} = gl$ at the upright equilibrium. The swing-up controller either injects or subtracts energy from the pendulum by setting the cart's acceleration:
$$ \ddot{x} = k_E(E - E_{\text{top}})\operatorname{sign}(\dot\theta\cos\theta) - k_x x - k_{\dot{x}}\dot{x}, $$where the first term is a proportional energy pump and the $k_x$, $k_{\dot{x}}$ terms provide cart-centering to prevent runaway drift. The tuned gains are $k_E = 0.15$, $k_x = 0.2$, $k_{\dot{x}} = 0.3$.
LQR balance
Near $\theta = 0$ the dynamics are approximately linear. Writing the state as $\boldsymbol{s} = (x,\,\dot{x},\,\theta,\,\dot\theta)^\top$, the linearisation gives $\dot{\boldsymbol{s}} = A\boldsymbol{s} + Bu$. The linear-quadratic regulator minimises the cost
$$ J = \int_0^\infty \!\bigl(\boldsymbol{s}^\top Q\,\boldsymbol{s} + u^\top R\,u\bigr)\,dt $$with $Q = \operatorname{diag}(1, 1, 10, 1)$ and $R = 0.1$. Here the diagonal entries of $Q$ encode how strongly we wish to control the variables $(x,\,\dot{x},\,\theta,\,\dot\theta)$, while $R$ controls the magnitude of the action taken by the LQR, with a small $R$ allowing for larger actions. The optimal gain $K$ is obtained once by solving the algebraic Riccati equation, giving the LQR action $\ddot{x} = -K\boldsymbol{s}$. The expert switches from swing-up to LQR when $|\operatorname{wrap}(\theta)| < 0.4$ and $|\dot\theta| < 3$.
Network and training
The network is a two-hidden-layer MLP with $\tanh$ activations and a linear output:
$$ \begin{aligned} Z_1 &= W_1\boldsymbol{s} + b_1, &\quad A_1 &= \tanh(Z_1), \\ Z_2 &= W_2 A_1 + b_2, &\quad A_2 &= \tanh(Z_2), \\ u &= w_3^\top A_2 + b_3, \end{aligned} $$with hidden width $h = 36$ and weights initialised from $\mathcal{N}(0, 1/n_{\text{in}})$. The training loss is the mean squared error over a mini-batch:
$$ \mathcal{L} = \frac{1}{B}\sum_{i=1}^{B}\bigl(u(\boldsymbol{s}_i;\,W) - u_i^*\bigr)^2. $$Gradients are computed by two-layer backpropagation and weights are updated by mini-batch SGD for 1000 epochs. The samples are split approximately 85/15 into training and validation sets.
The dataset is generated by rolling out the expert from many randomised initial conditions. Exploration noise is added to the expert's actions so that trajectories drift off the ideal path, forcing the expert to demonstrate recovery from states the network will encounter during deployment. This broadens the training data but does not eliminate distribution shift. Finally, to prevent the data being overloaded with states near the inverted position, only 40% of those states are kept.
Implementation
The network and backpropagation are both implemented from scratch. forward
computes activations and caches them for the backward pass;
backward propagates the MSE gradient through each layer using the
identity $\tanh'(z) = 1 - \tanh^2(z)$, which is recovered cheaply from the cached
activations without storing pre-activations.
def forward(X):
    Z1 = X @ W1.T + b1
    A1 = np.tanh(Z1)
    Z2 = A1 @ W2.T + b2
    A2 = np.tanh(Z2)
    P  = A2 @ w3 + b3
    return P, (X, A1, A2)

def backward(cache, P, Y):
    X, A1, A2 = cache
    B = len(Y)

    dP  = 2 * (P - Y) / B

    gw3 = A2.T @ dP
    gb3 = dP.sum()
    dA2 = np.outer(dP, w3)

    dZ2 = dA2 * (1 - A2 ** 2)
    gW2 = dZ2.T @ A1
    gb2 = dZ2.sum(axis=0)
    dA1 = dZ2 @ W2

    dZ1 = dA1 * (1 - A1 ** 2)
    gW1 = dZ1.T @ X
    gb1 = dZ1.sum(axis=0)

    return gW1, gb1, gW2, gb2, gw3, gb3
Results
The videos below show the initial saved checkpoint and the trained controller. The initial controller makes no meaningful attempt to invert the pendulum. After training, the network swings the pole up from the hanging position and holds it balanced for the remainder of the recorded simulation.
The weight diagrams below visualise the magnitude of each weight matrix at four points during training. Their magnitudes change as training proceeds, but the diagrams alone do not establish which input is most important: the inputs have different scales, and the effect of a weight depends on the rest of the network.
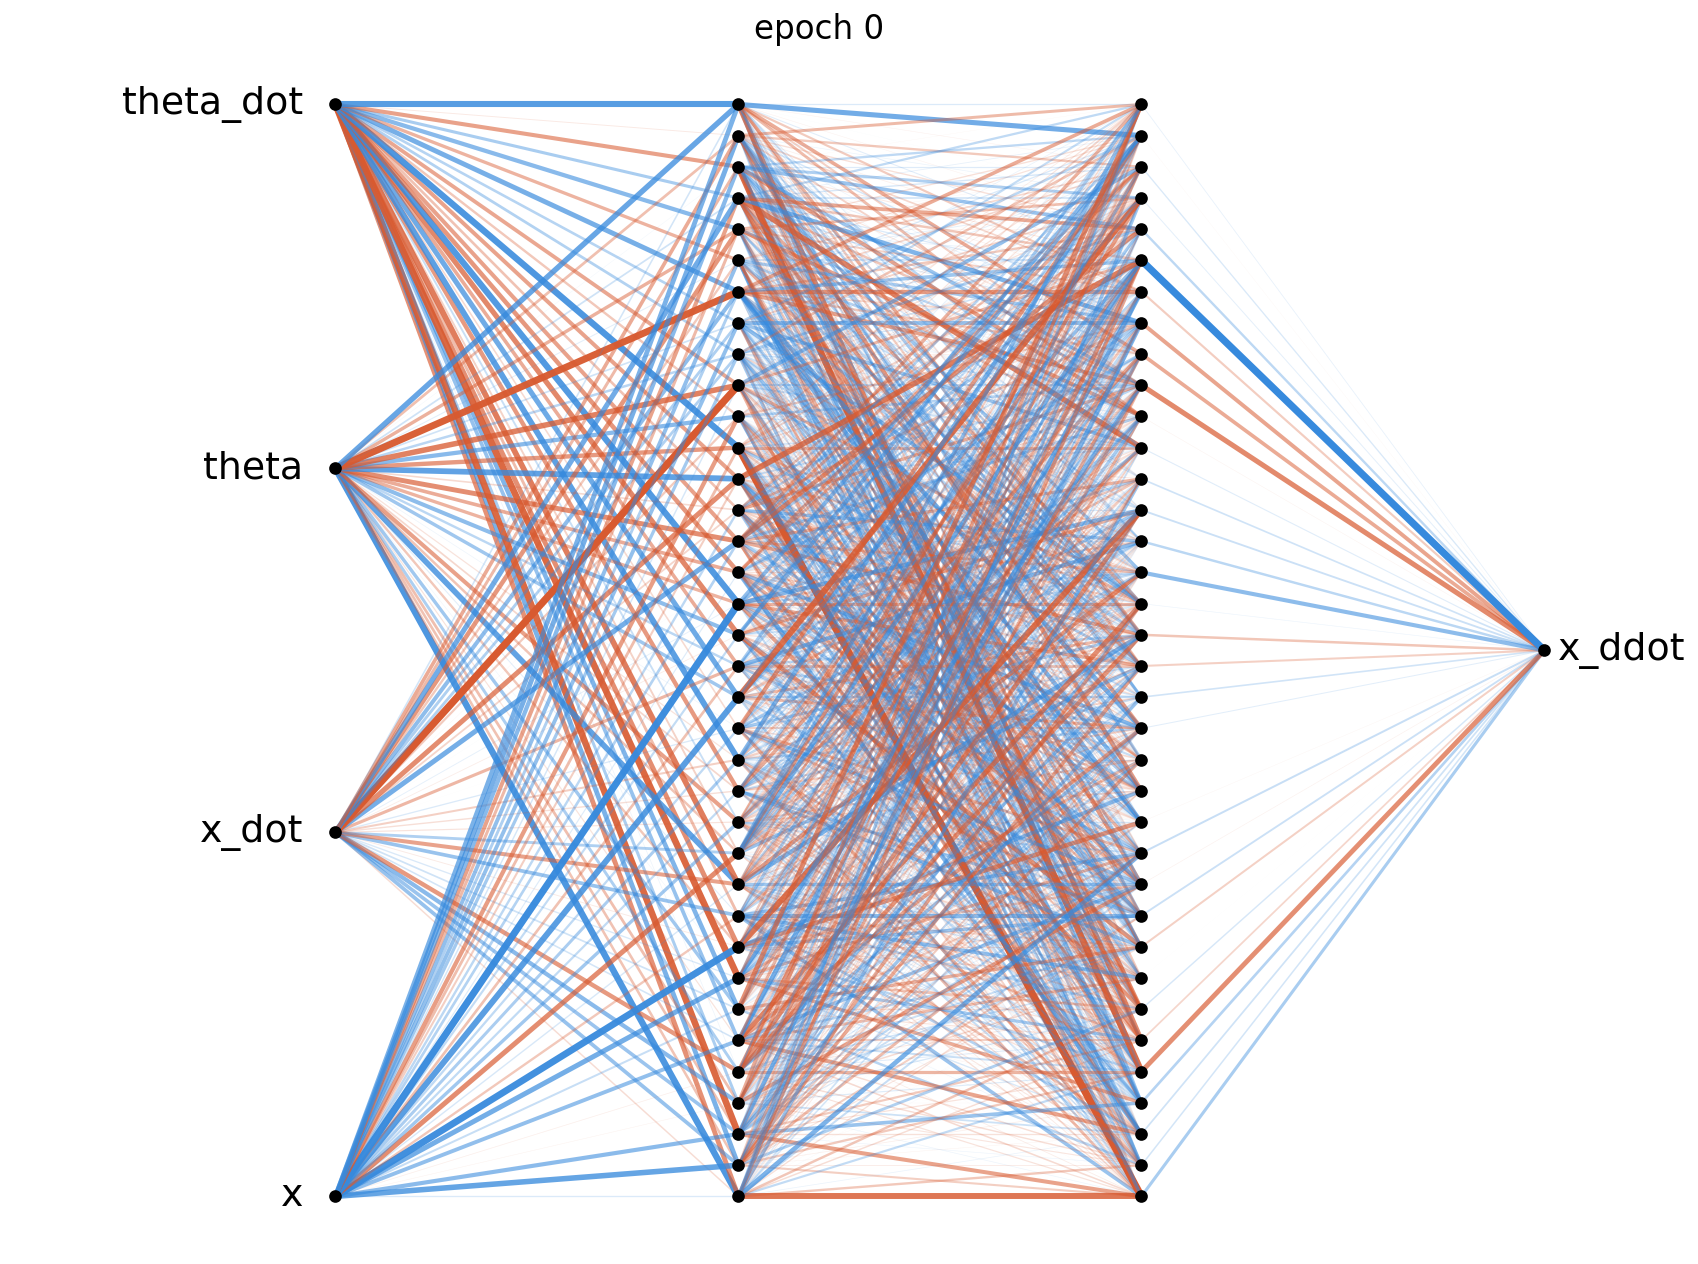
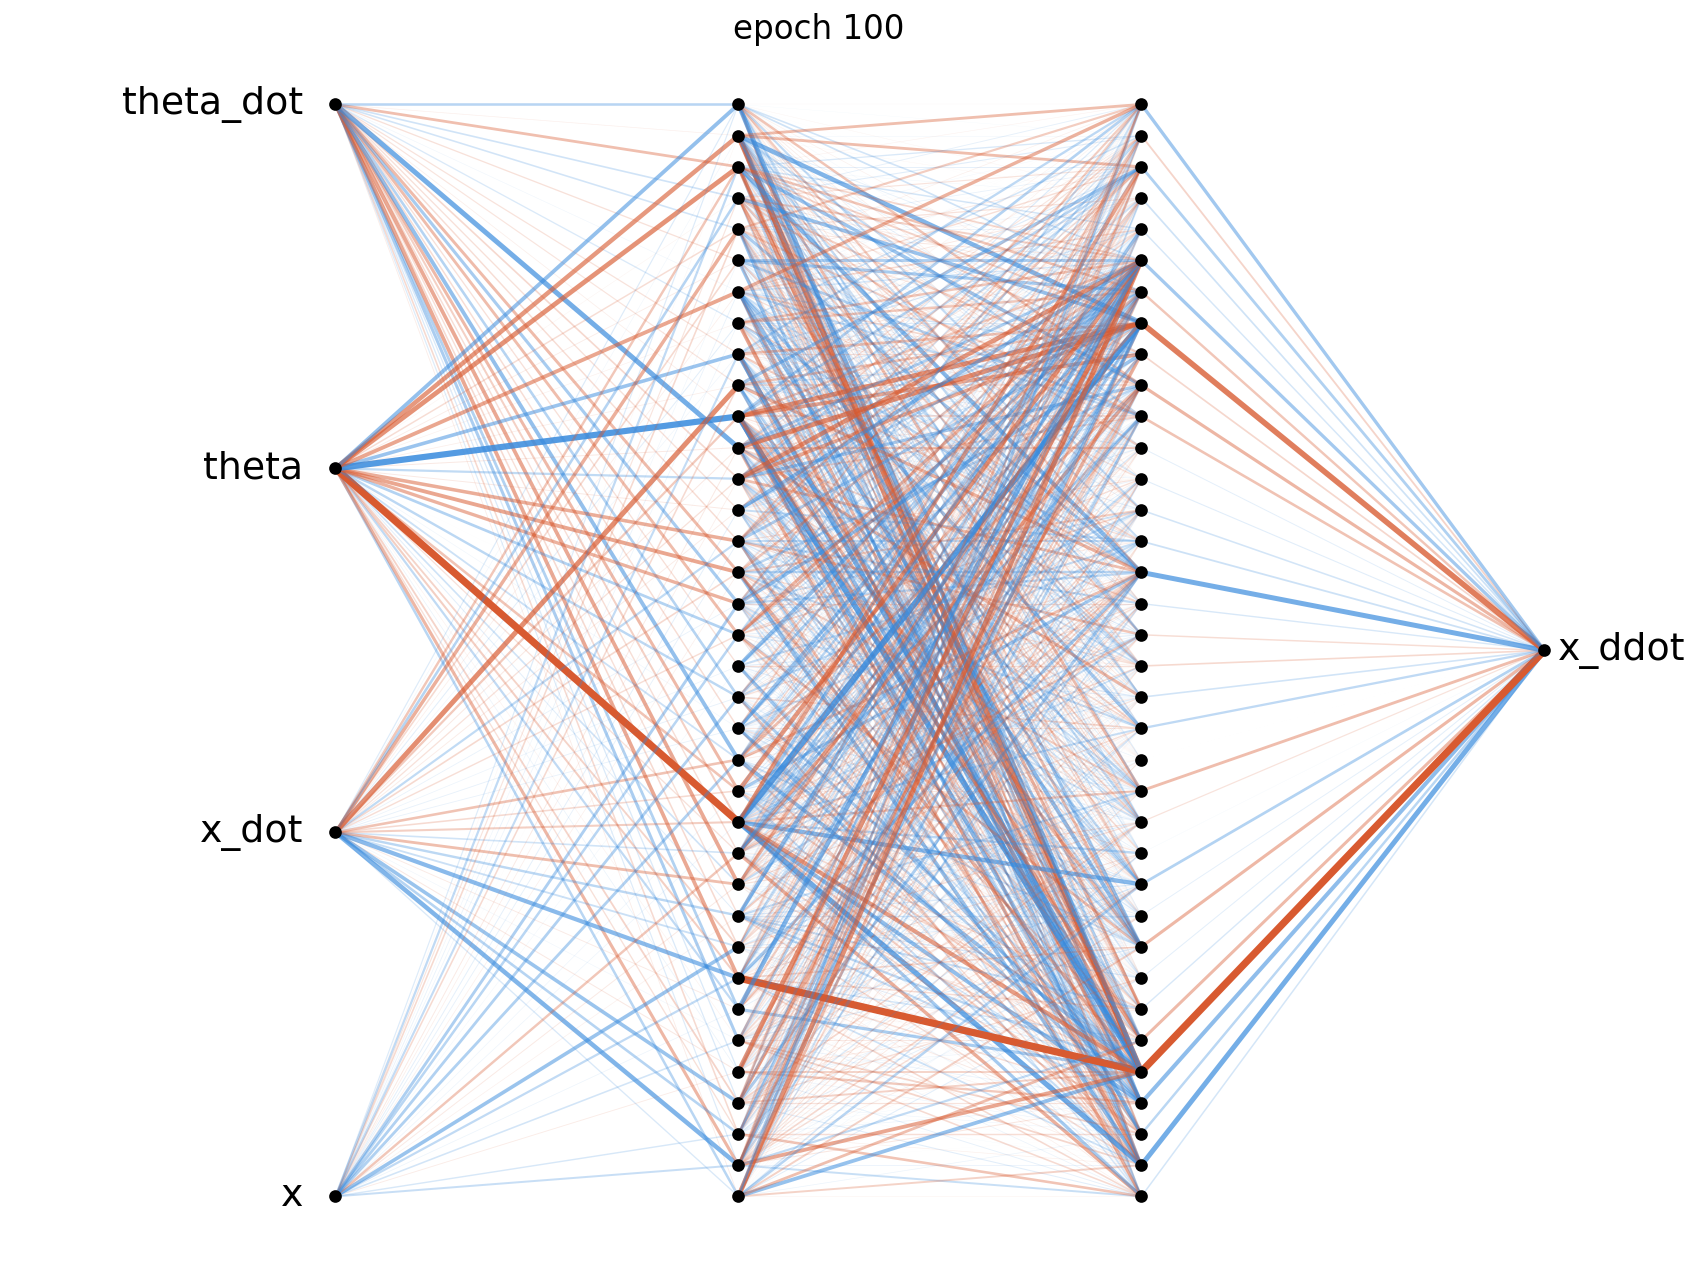
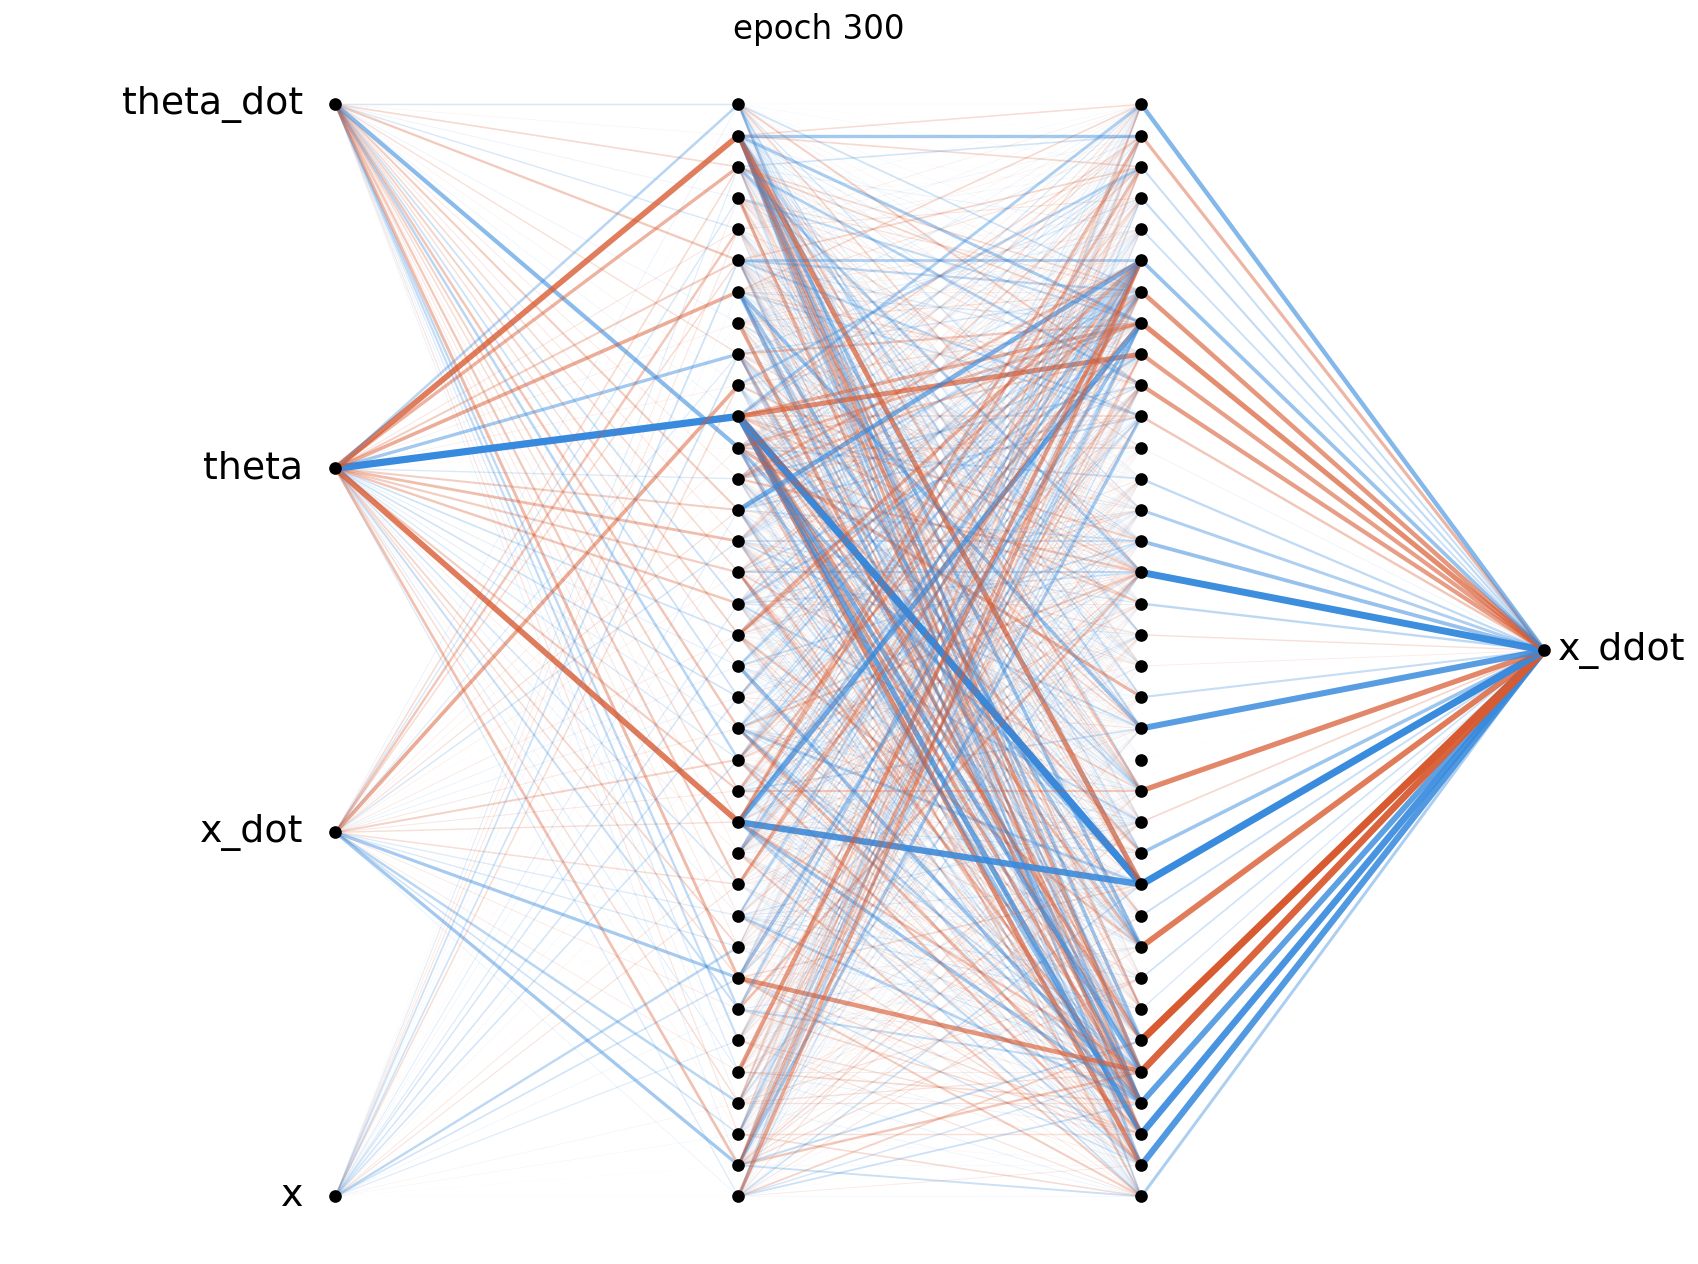
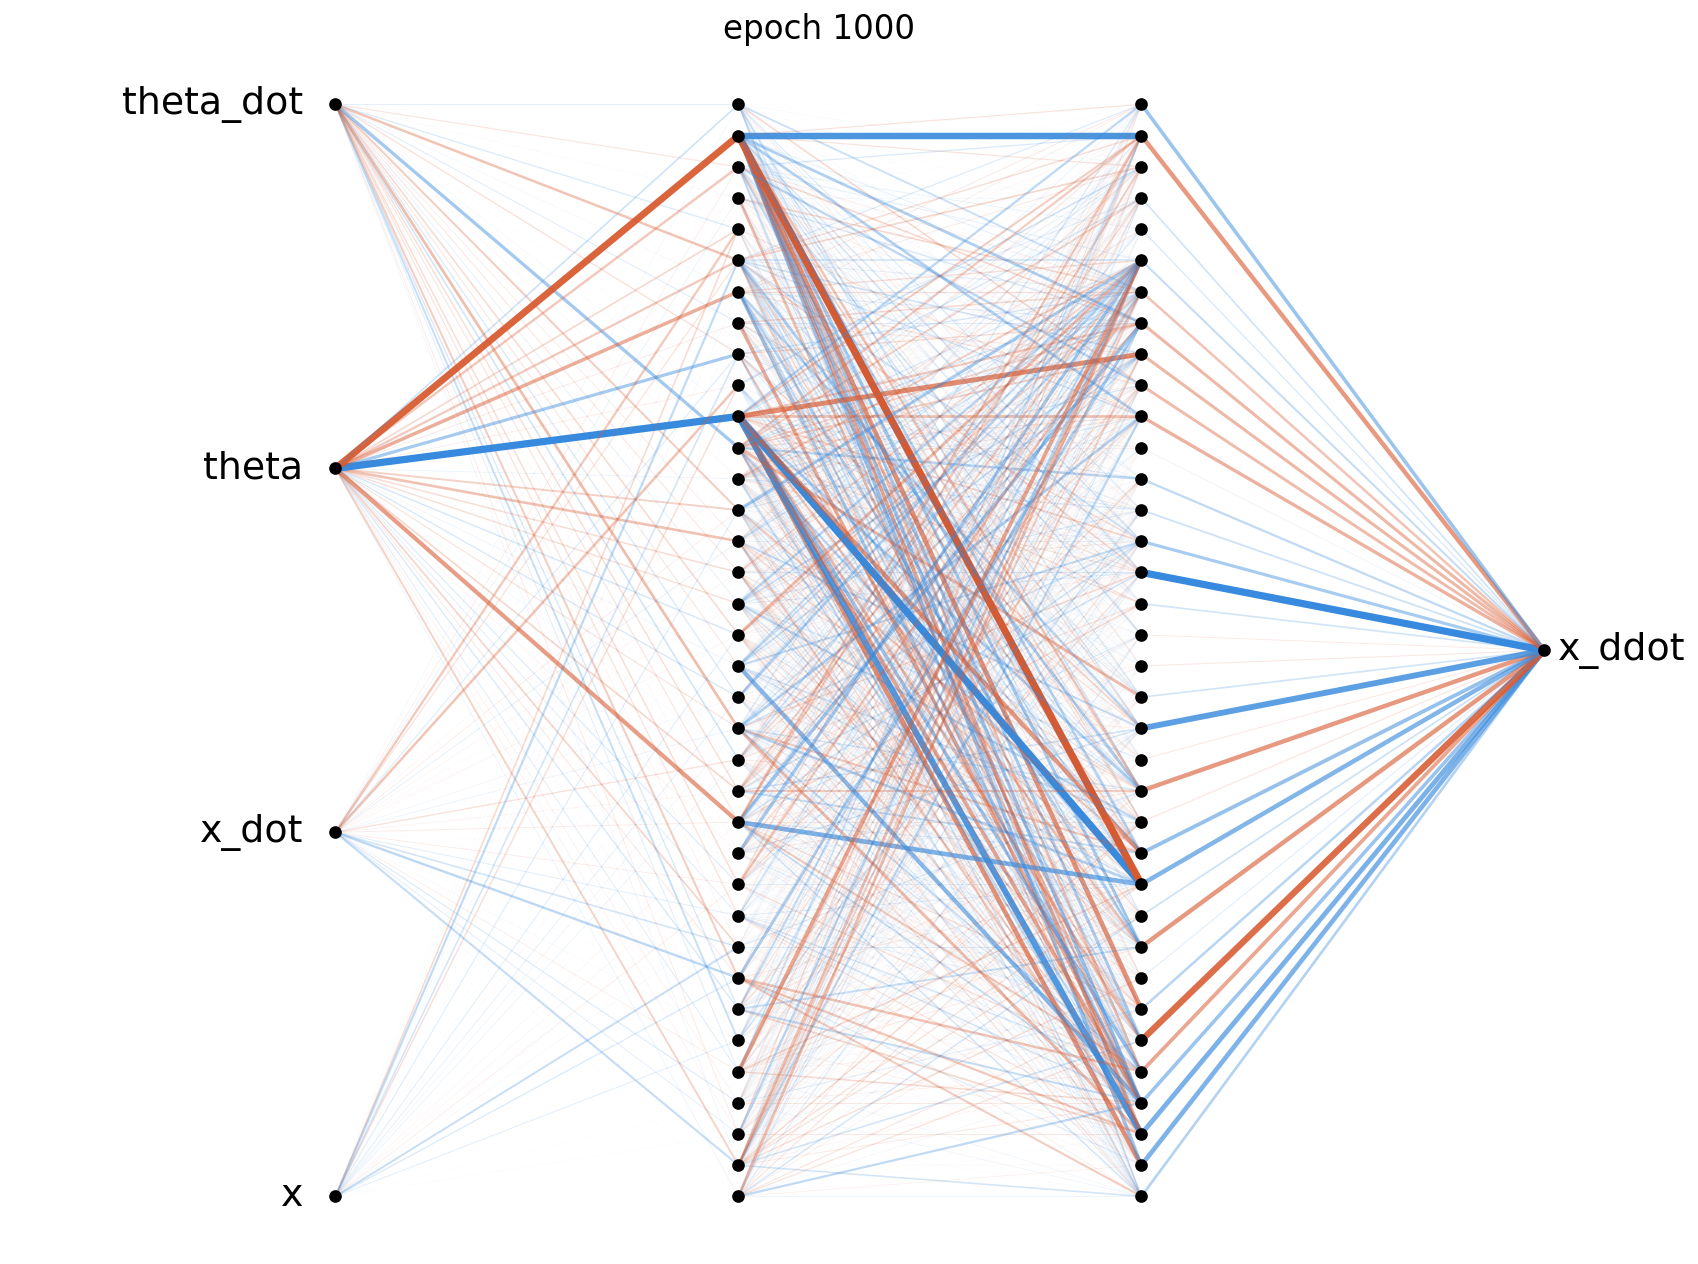
The above diagrams were generated using visualize_network.py, where orange connections represent positive weights and blue represents negative weights. The thickness and opacity of the connections are proportional to the magnitude of each weight.
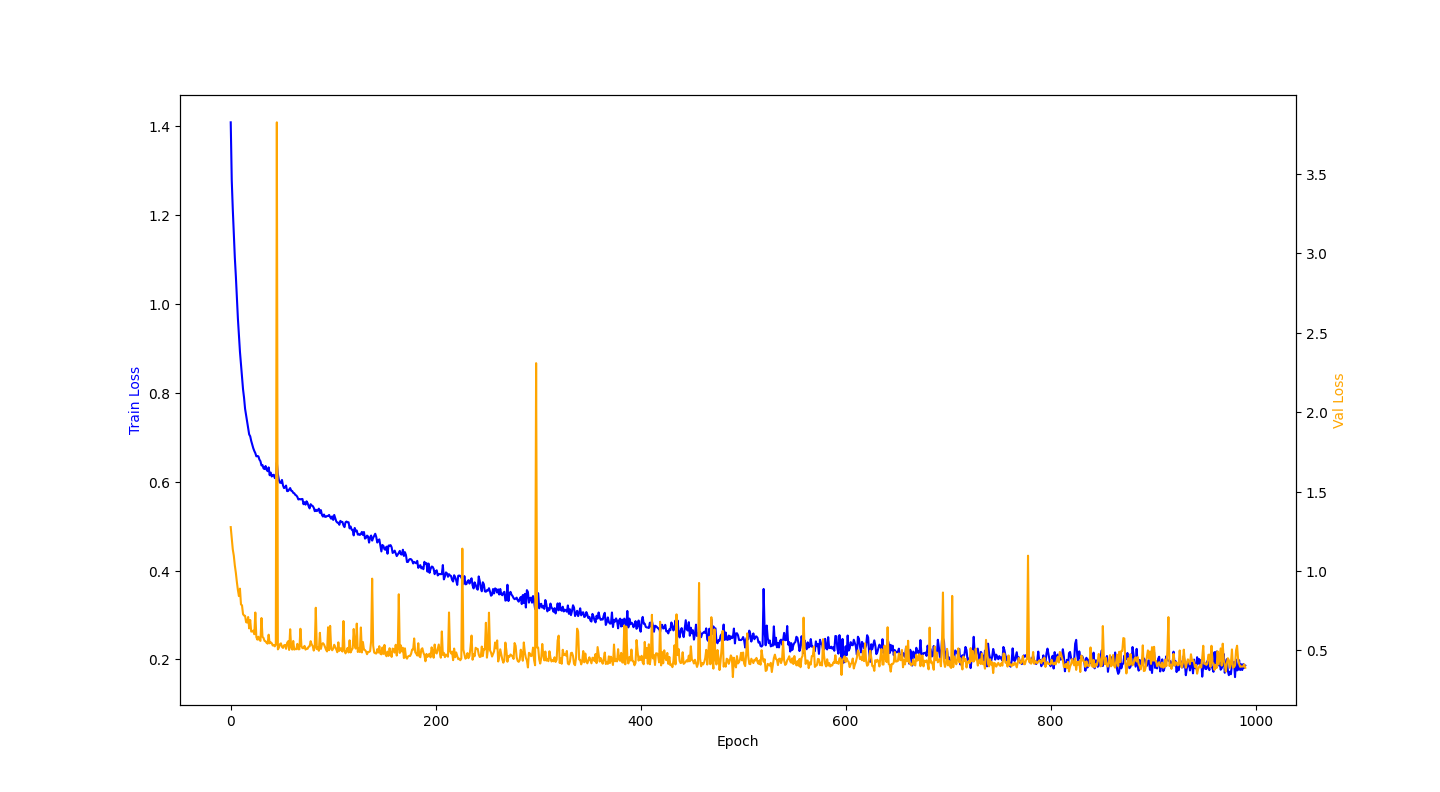
The training curve shows the MSE on both the training and validation sets across epochs. The two losses are plotted on separate vertical axes. Training and validation samples come from the same trajectories, so the validation loss measures fit to similar states rather than to entirely new runs.